

Ripple (XRP) has been down by 10.29% over the last three months. The price trend of three months can be divided into three major swings, and the range of the swings has been between 0.3204 USD and 0.2300 USD.
Ripple Price Analysis
XRP coin was being traded at 0.27 USD on August 23, and over the next 26 days, it got a hike of 18.67% to reach 0.3204 USD. The next variation happened between September 18 & 24, and in these 6 days, Ripple price lost a whopping 28.20% to touch 0.2300 USD. It was followed by a 35.88% hike in the value that took the price to as high as 0.3121 USD by November 07. The last variation happened between November 07 & 21, and in these 14 days, the currency lost another 23.22% that pushed the Ripple price to 0.2397 USD from 0.3121 USD.
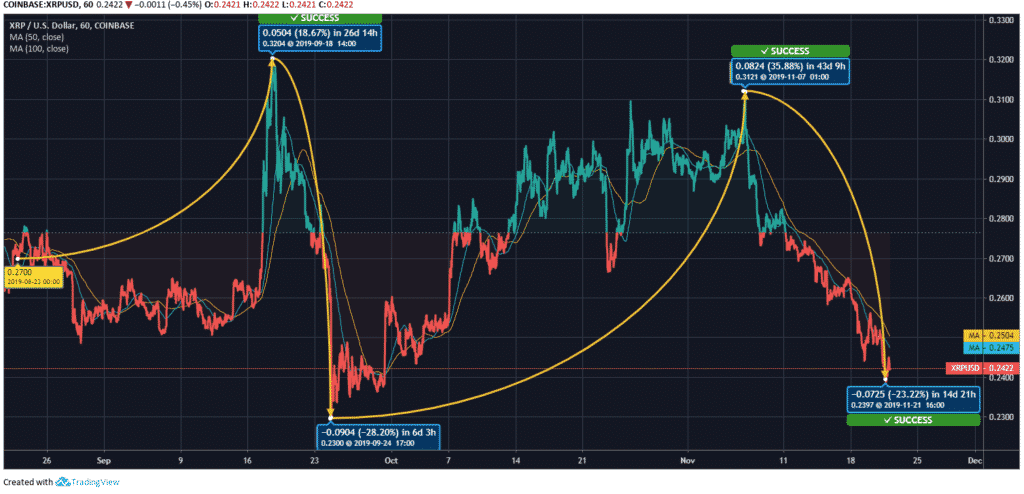
The market cap on August 23 was 11.866 billion USD, and it has been decreased to 10.504 billion USD over these last 90 days. Ripple’s 50 days MA is now at 0.2475 USD, and it’s 100 days MA stands at 0.2504 USD. The current price of XRP coin is 0.2422 USD is less than both the averages.
| Ripple (XRP) | Resistance and Support Levels |
| 1st Resistance | $0.25125 |
| 2nd Resistance | $0.25874 |
| 3rd Resistance | $0.26398 |
| 1st Support | $0.23852 |
| 2nd Support | $0.23329 |
| 3rd Support | $0.22580 |


